![]()
 | _tdFATL (Fast Adaptive Trend Line) which practically shows the mathematical expectation of Close on any bar; _tdSATL (Slow Adaptive Trend Line) The meaning of the SATL indicator is to be mathematical expectation of FATL. The increasing line of SATL corresponds to the bull trend on the market and decreasing SATL corresponds to bear trend; _tdRFTL (Reference Fast Trend line) describes a response of the digital filter on the discrete sequence of market prices but with delay equal to Nyquist interval of the filter used in FATL; _tdRSTL (Reference Slow Trend line) describes a response of the digital filter on the discrete sequence of market prices but with delay equal to Nyquist interval of the filter used in SATL; _tdFTLM (Fast Trend Line Momentum) shows the momentum of FATL and is calculated by equation FTLM= FATL-RFTL; _tdSTLM (Slow Trend Line Momentum) shows the momentum of SATL and is calculated by equation STLM= SATL-RSTL. |
 | All products of Lighttek Software: - Talisman Desktop (one user license). Alteros3D (one user license) and all skins - Melody (one user license) - IconTOY (one user license) - CD-version of Lighttek's website. (including a lot of unique themes that are available only on this CD) - Additional Shapes, Clocks, Icons, Menus for Talisman. |
 | _tdFATL (Fast Adaptive Trend Line) which practically shows the mathematical expectation of Close on any bar; _tdSATL (Slow Adaptive Trend Line) The meaning of the SATL indicator is to be mathematical expectation of FATL. The increasing line of SATL corresponds to the bull trend on the market and decreasing SATL corresponds to bear trend; _tdRFTL (Reference Fast Trend line) describes a response of the digital filter on the discrete sequence of market prices but with delay equal to Nyquist interval of the filter used in FATL; _tdRSTL (Reference Slow Trend line) describes a response of the digital filter on the discrete sequence of market prices but with delay equal to Nyquist interval of the filter used in SATL; _tdFTLM (Fast Trend Line Momentum) shows the momentum of FATL and is calculated by equation FTLM= FATL-RFTL; _tdSTLM (Slow Trend Line Momentum) shows the momentum of SATL and is calculated by equation STLM= SATL-RSTL. |
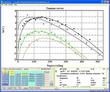 | O User has ability to copy/paste screen chart as a bitmap picture into MS Office applications as well a content of result panel in form of a table. O X-Y chart of two variable dependence and curve fitting with least square method (variety of user interfaces to chose from), signals revealing and user defined formula. |
 |  |

Network & desktop search |
Search My Network |
LAN Find |
Reminder software |
Software downloads |
WordNet-Online dictionary |
Thesaurus |
CV
Access us via www.LuckyDownloads.com
or www.L-DL.com
Copyright © 2005 Lucky Downloads